Figure 3

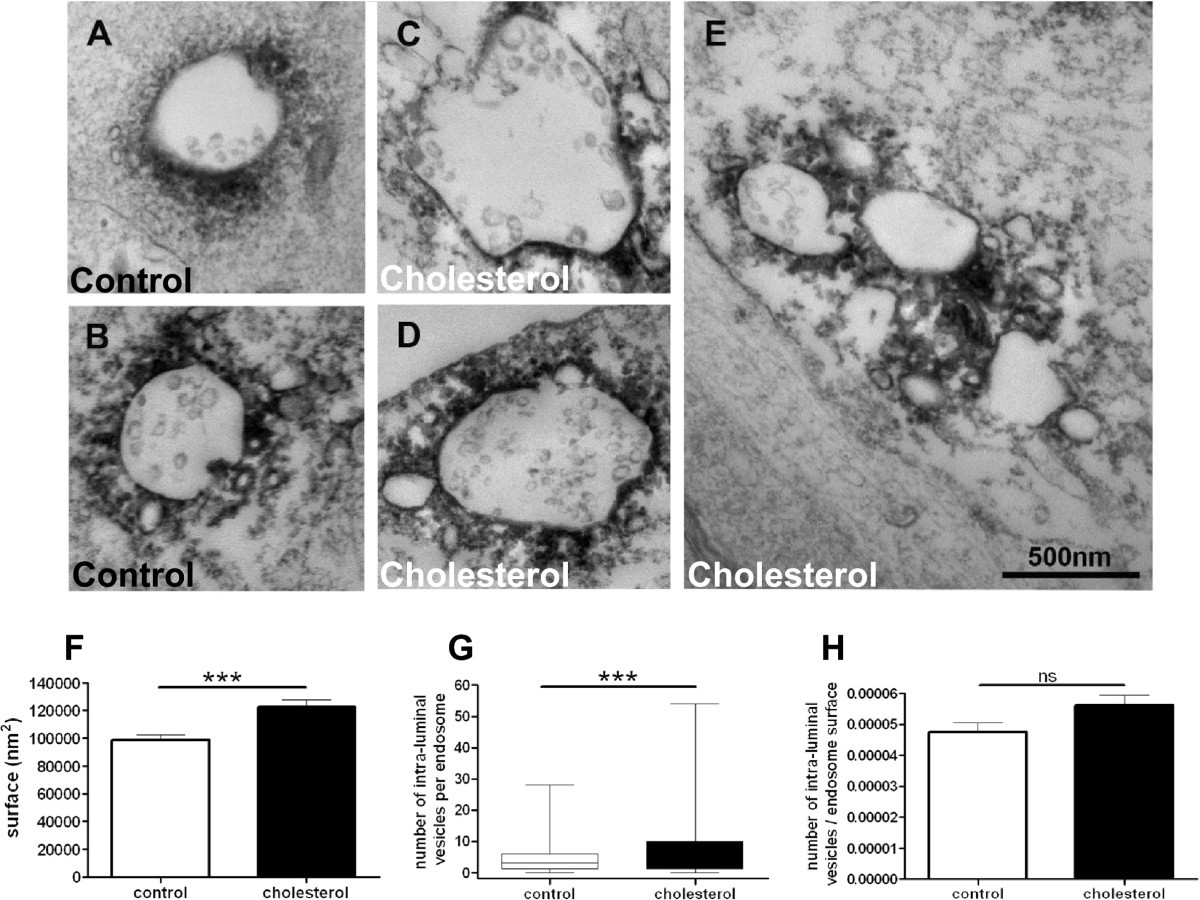
Transmission electron microscopy reveals that membrane cholesterol increase leads to enlargement and aggregation of EEA1-positive early endosomes containing more intraluminal vesicles (ILVs). (A-E) Representative electron micrographs of EEA1-labelled structures in control (A and B) or cholesterol-treated (C, D and E) cortical neurons. Bar in E = 500 nm and is for all micrographs. (F) Surface of individual EEA1-labelled endosomes (*** stands for p < 0.001 in unpaired t test with Welch’s correction, n = 244 control and 284 cholesterol-treated endosomes). (G) Number of ILVs per EEA1-labelled endosome (*** stands for p < 0.001 in unpaired t test with Welch’s correction, n = 1060 control and 1978 cholesterol-treated ILVs). (H) Number of ILVs to endosomal surface ratio (ns stands for p > 0.05 in unpaired Student’s t test, n = 244 control and 284 cholesterol-treated endosomes).
