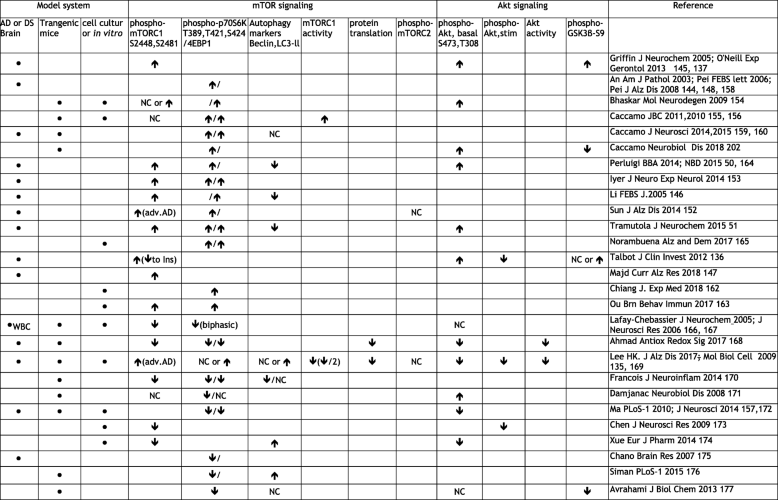
- Summary of the literature directly reporting on mTOR. The model systems employed by the various authors/laboratories referenced on the far right, are noted in the far left. 'Alzheimer or Down syndrome brain' may include other human cell types and either be post-mortem fixed, frozen or ex vivo. 'Transgenic mice' are rodent models that harbor human disease-causing mutations but include β-amyloid- or viral transgene-injections into wild type animals. 'Cell culture' refers to the use of primary neurons, immortalized lines, or mouse brain tissue slices that are transfected or exposed to β-amyloid, APP, tau or Presenilin as models of AD injury. Also included therein are other in vitro assays. mTOR signaling changes include phospho-mTOR, downstream targets phospho-p70S6K or p-4EBP-1, and enzymatic activity measurements as evidence for activation. The direction of change is noted, e.g. (↑) indicates hyperstimulation. Whether macroautophagy is initiated is also indicated. If data on Akt activation (p-Akt, insulin-stimulated p-Akt, downstream target phospho-GSK3β, or enzymatic activity is provided, a hyperactivation (↑) or inhibition (↓) is noted. A change qualified by context is noted by an 'or'. NC= no change. Most, but by no means all, studies favor hyperactivation of Akt and mTOR in various amyloid injury models, (top half of table) vs. inhibition (bottom half). Significant differences in model employed, stage of disease severity, time course, and other technical issues, account for the dichotomous findings (see text). Note that very few report on actual enzymatic activity assay. mTORC2 is relatively understudied in AD. See abbreviations. The compilation is illustrative only and not meant to be exhaustive. The authors apologize for any inaccuracies and unintended omissions
- Table references are cited as : First Author, Journal, Year and reference number
